Netscaler Performance Woes…
Hey all and welcome to my first blog post.
I was recently involved in a new Netscaler implementation. Two Netscalers (5550 MPX) were purchased and will be configured in a HA pair. They currently have 2 other Netscalers (5500 MPX) that are used for production. This project is to setup the new Netscalers in the new DMZ and migrate services.
The client chose a 3 arm approach due to a newly archicted DMZ setup. 1 arm goes to 1 interface, this will be dedicated to management traffic. The other two arms will be configured through 2 interfaces setup in a LACP bond and tagging two vlans. After a few days some routing problems a colleague of mine shared with me a nice feature for multi-arm configurations, called Mac Based Forwarding. This essentially communicates to services going through the same gateway/interface it came in on. This helps with hairpinning, which is when the router/security device will drop traffic because it expects it to be coming from a certain gateway, but it arrives on another.
Setting up the device was pretty straightforward, especially now with the wizards. I initially started on 10.5 and then installed 11.x shortly after it was released. I’m at the current build at the moment, which is 11.0.63.16. Shortly after upgrading the 11.x release i noticed some performance problems. I really didn’t even notice them until a couple weeks after I upgraded. The ‘performance problems’ were hit or miss, but basically the symptoms were unresponsiveness, laggy user interaction, and slow repaint issues with moving windows on the screen. For instance, the screenshot below is a picture of the netscaler GUI login window. This would take 5 seconds to repaint itself, loading some of the blue dots a section at a time.

I started comparing the performance with the other Netscalers that were already setup. I could connect to the same Server 2008R2 XA65 session server and the experience was flawless. Connections straight to the session server were comparable to their currently setup netscalers. This left me with a couple isolation steps.
Straight to the server was good, and the old netscalers are good. So the new netscalers are bad….what’s the difference?
The new Netscalers connect to a different DMZ, which connects to the same ASA, but separate DMZ cisco switches, which does more port permit/deny rules compared to the old Netscalers, which do a straight NAT to the internal network.
Throughout the troubleshooting process I tried:
- Creating new AG VIPs
- Adjusting different TCP profiles
- Adjusting Cache Parameters
- Downgrading to 10.5 and 10.1
- Disabling TLS on backend services (https://www.citrix.com/downloads/netscaler-adc/firmware/release-110-build-6316.html)
- Testing traffic through the management port
- Breaking the LACP bond and testing with 1 interface
- Adding an arm into the internal network, bypassing the DMZ/firewall completely
- Removing Features/modes
- Integrated Caching
- HTTP Optimization
- Front End Optimization
- Appflow
- Session Reliability
- Basically everything, but the bare minimum.
I soon correlated that performance problem to the ‘available bandwidth’ metric using HDX Monitor. When I experienced the lag, I saw the ‘available bandwidth’ metric drop significantly. The RTT and ICA RTT would skyrocket, and ‘badwidth used’ would go up to 100%.
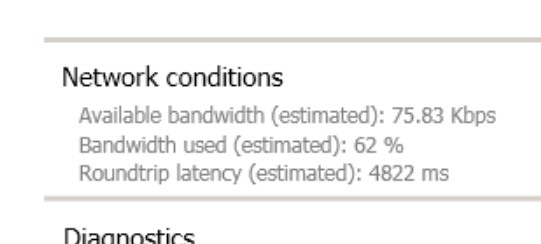
I confirmed this with perfmon statistics along with Netscaler Insight Center stats.
I could simultaneously connect to the same backend server on the old Netscalers using a different username, using the same endpoint/internet connection. I’d get these results.
I also did a couple Bandwidth/Speed tests to the location where the datecenter is located. http://www.speedtest.net/ . Everything coming back normal.
I did notice there were other people experiencing similar situations, with no actual fix, but to restore to a backup or an earlier version. https://discussions.citrix.com/topic/370744-slow-performance-going-through-ica-proxy-connection/
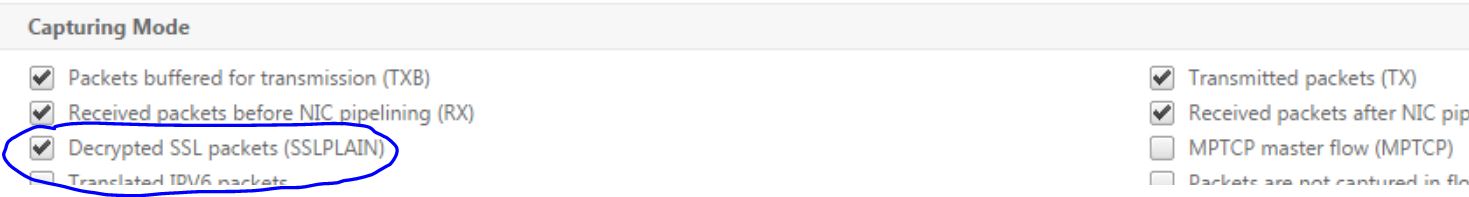
After opening a support case and some inital data gathering, we started capturing Traces on the Netscaler and Wireshark packets on the endpoint/Session Server. One thing that might save you some time is using the new ‘Decrypt SSL’ featuer on the Netcaler trace. This essentially decrypts the SSL packets so Citrix can inspect them easier.
After they received the latest capture/trace file the ticket was escalated to level 3. They were able to confirm this is a known bug, WITH A WORKAROUND.
Hello Steve,
The performance degradation is due to a regression introduced in 10.5.59.x builds which is being currently tracked under BUG TSK0606493.
Workaround/Fix:
The workaround for now would be to change the tcp flavor to BIC from default by executing the below command.
set ns tcpProfile nstcp_default_XA_XD_profile -flavor BIC
Also, enable SACK on the TCP Profile for XA/XD, we will go over this shortly on the GTM Session.
You could imagine my excitement when I received this email. A month of troubleshooting and tinkering only to be resolved by a couple steps. I applied the changes and confirm by AG VIP was using the ‘nstcp_default_XA_XD_profile’ TCP profile. I didn’t notice the change in performance until I disconnected/reconnected.
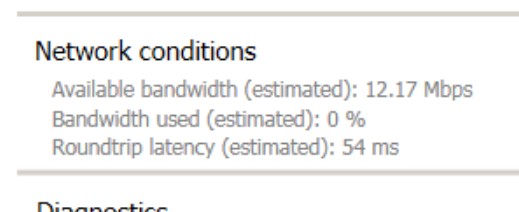
Here are my new HDX Monitor results. I haven’t experienced any fluctuation in performance since applying the changes.
So far so good on my performance issues! Support did say this will be fixed in the next version. I hope I save you all some time.
**********************************************************************************************************************************
**********************************************************************************************************************************
**Update** (12/9/2015)
About 5 hours later I noticed the ‘Available Bandwidth’ metric starting to slowly creep down. It finally stabilized around 700Kbps. The session does still seem responsive, a lot more than before. However, this metric should not get this low. Again, I connected up to the old Netscalers simultaneously and confirm the 10+Mbps metric.
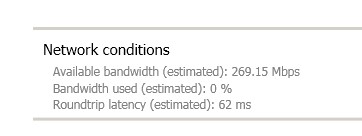
I visited a couple sites to confirm the exact checkboxes needed for the XA/XD TCP Profile and I ended up with this result (I confirmed this with Citrix Support):
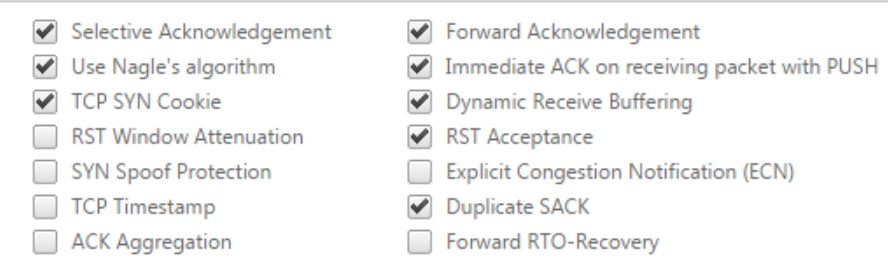
After making the change I disconnected/reconnected my citrix session. I’m again seeing the expected ‘Available Bandwidth’ metric. I’ll give this a couple days to confirm stability.
************************************************************************************************************************************
************************************************************************************************************************************
While the ‘workaround’ i was provided doesn’t seem to 100% fix the issue, the results are still so much better than doing nothing, other than reverting to a previous version.
************************************************************************************************************************************
************************************************************************************************************************************
**Update** (12/14/2015)
After a few days I noticed the ‘available bandwidth’ was higher, and it only dropped to around 800Kbps. I wanted to 100% confirm a rollback would fix the issue. I ended up downgrading both Netscalers to the 10.5 safe harbor build (10.5.56.22). So far so good with connection stability.
Citrix Support said this will be permanently fixed in version 11.0.65.x. They did mention that 11.0.64.x will be released in a couple days, but will not contain the fix.
**Update** (3/23/2016)
Citrix just released Netscaler firmware version 11.0.65.32. With this release the bug is listed as fixed
With the default TCP congestion control, a NetScaler appliance recovering from packet loss reduces the congestion window to half its previous length. With multiple packet loss events, the congestion window becomes small and delays transactions.[# 606493, 601655, 623185]
Hi, I am seeing similar issue to your case. Having MBF enabled, and afterwards an decrease in performance and overall stability started to arrive. I have support ticket at Citrix Support right now, would you be able to share you support ticket number and/or any bug id´s at Citrix, so I can reference these?
Thanks.
11.0.65.x should be releasing very soon. All has been well upon reverting back to 10.5. Here is my support case, that is now closed. Support# 70599314
How did you use perfmon as part of the diagnosis? We have similar symptoms but can’t see it in Insight. Don’t have HDX setup – thanks
I used HDX Monitor – this is a free tool from Citrix to give a plethora of information in regards to the session details. You can download it here: https://cis.citrix.com/hdx/download/