VSAN in the Home Lab – Part 2 (Benchmarks)
***EDIT***
The OCD in me couldn’t go through this blog post with an ‘old’ version of VSAN. VMware just released VSAN 2.0 with vSphere 6 update 2. My vCenter and the ESXI hosts have now been updated. For a nice blog on what’s new, you can read this – (http://www.yellow-bricks.com/2016/02/10/whats-new-for-virtual-san-6-2/)
***********
In Part 1 of this series I went through Enabling and Configuring VSAN. Now that we have an operational Datastore, we need to figure out if it’s actually usable. Don’t get me wrong, I’m sure it’s functional and operational, but don’t we want to see how this bad boy performs? Just to refresh your memory we are running 1x HDD and 1xSSD on each host in a 3x host configuration. Obviously if performance is your main goal, you should make the disk group 100% SSD based.
The past couple years I’ve used a few 3rd party tools to diagnose/benchmark performance. For this blog post I’ll be taking a look at Iometer, VSAN Performance stats (integrated with VSAN), and CrystalDiskMark. I’m all ears if anyone has any suggestions on additional programs (free) or specific tweaks with the current tools for better real world scenarios. I do understand that we could tweak and try different tests for the next year. So hopefully these couple of tests provide us a simple ‘overview’.
One thing to note: The performance numbers in my lab may be different than the performance numbers in your lab/environment. This is due to differences in hardware, disk type, storage, etc… So, what I’m trying to say is, don’t shoot the messenger.
Test Scenario:
- Windows 8.1 Virtual Machine
- patched
- 2vCPU
- 8GB Memory
- C:\ on VSAN Datastore
- E:\ on VSAN Datastore
- F:\ on FreeNAS Datastore
I’ve decided to run my tests side by side my FreeNAS box. This is my primary storage in my HomeLab.
FreeNAS Host:
- HP Proliant DL160 G6
- 24GB Memory
- 16vCPU w/ Hyperthreading
- 1Gbps Network
- 4x Western Digital black 3.5 7200 RPM 1TB Sata Drives (Raid 10)
- FreeNAS is my current storage location that houses around 20 running Virtual Machines. I don’t have any excessive performance VMs/Jobs running at the moment.
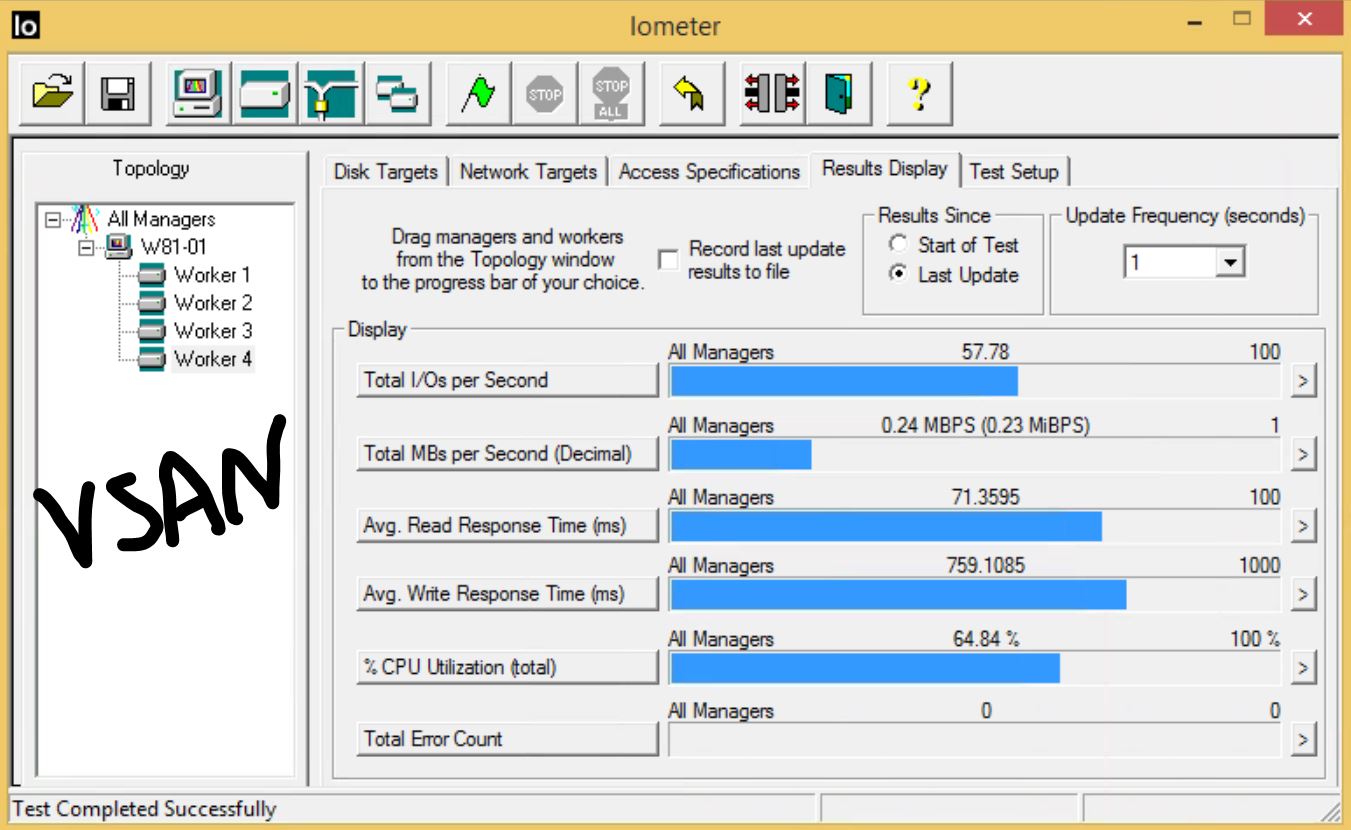
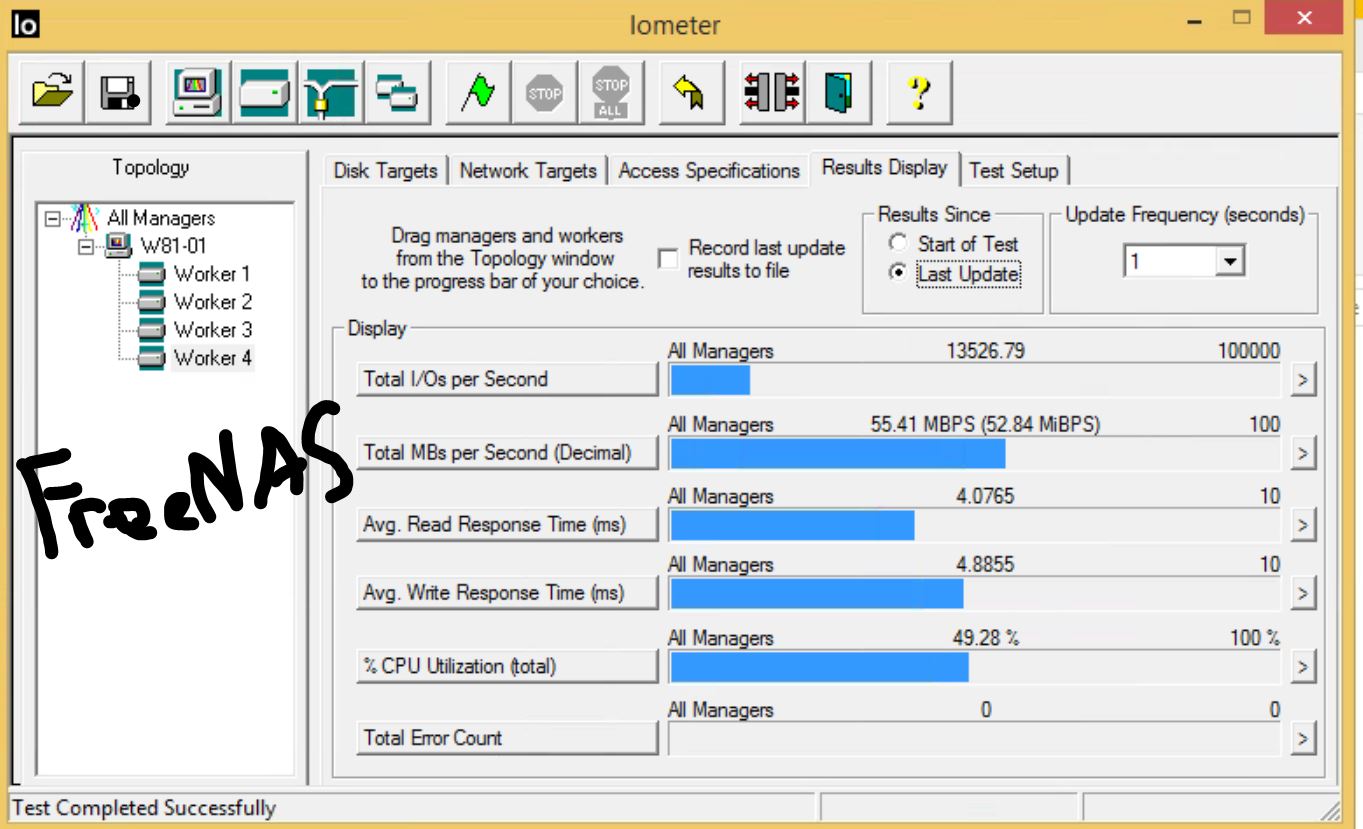
Let’s start with Iometer. A proven diagnosing/benchmarking tool since early 2000’s. For the past couple year’s I’ve been using the Atlantis article (https://community.atlantiscomputing.com/blog/Atlantis/August-2013/How-to-use-Iometer-to-Simulate-a-Desktop-Workload.aspx) to configure Iometer parameters that mirror data reads/writes to a VDI/Xenapp environment.
Iometer Results:
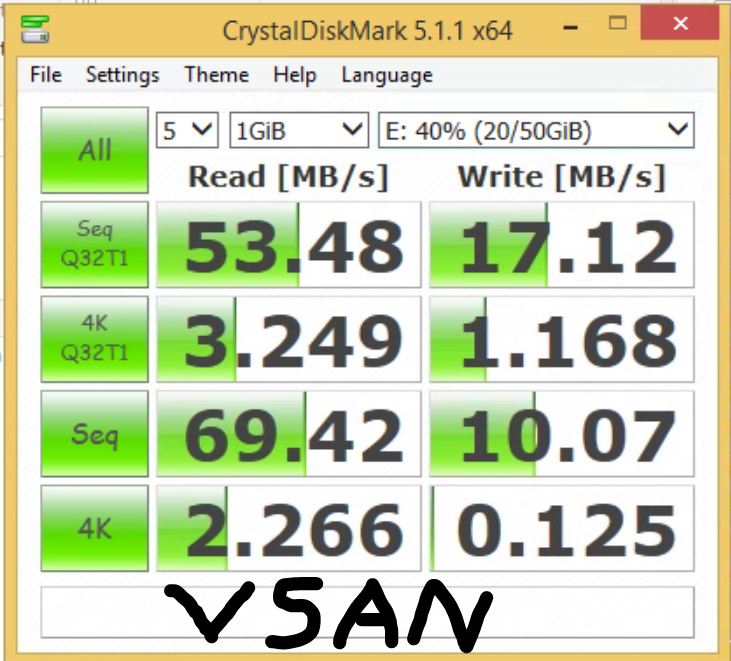
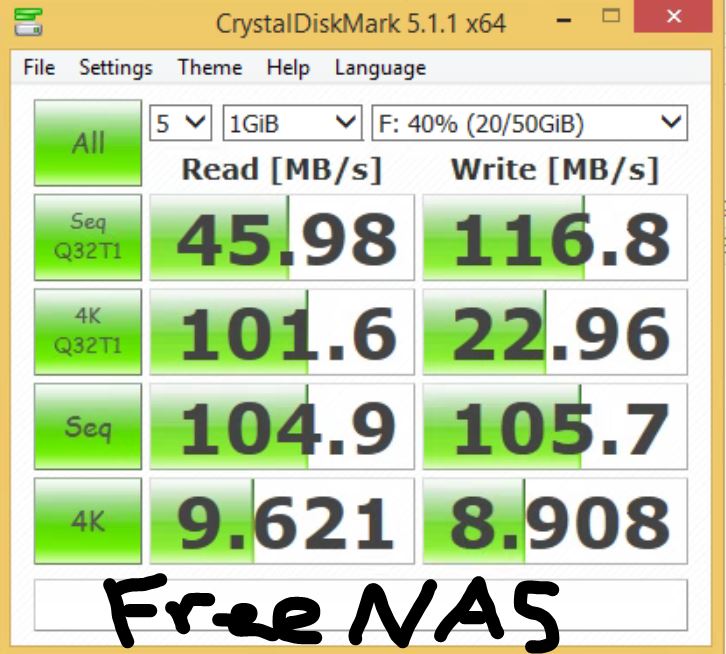
CrystalDiskMark Results:
- Seq – long, sequential operations. For SQL Server, this is somewhat akin to doing backups or doing table scans of perfectly defragmented data, like a data warehouse.
- 512K – random large operations one at a time. This doesn’t really match up to how SQL Server works.
- 4K – random tiny operations one at a time. This is somewhat akin to a lightly loaded OLTP server.
- 4K QD32T1 – (Queue Depth 32 and 1 thread) random tiny operations, but many done at a time. This is somewhat akin to an active OLTP server.
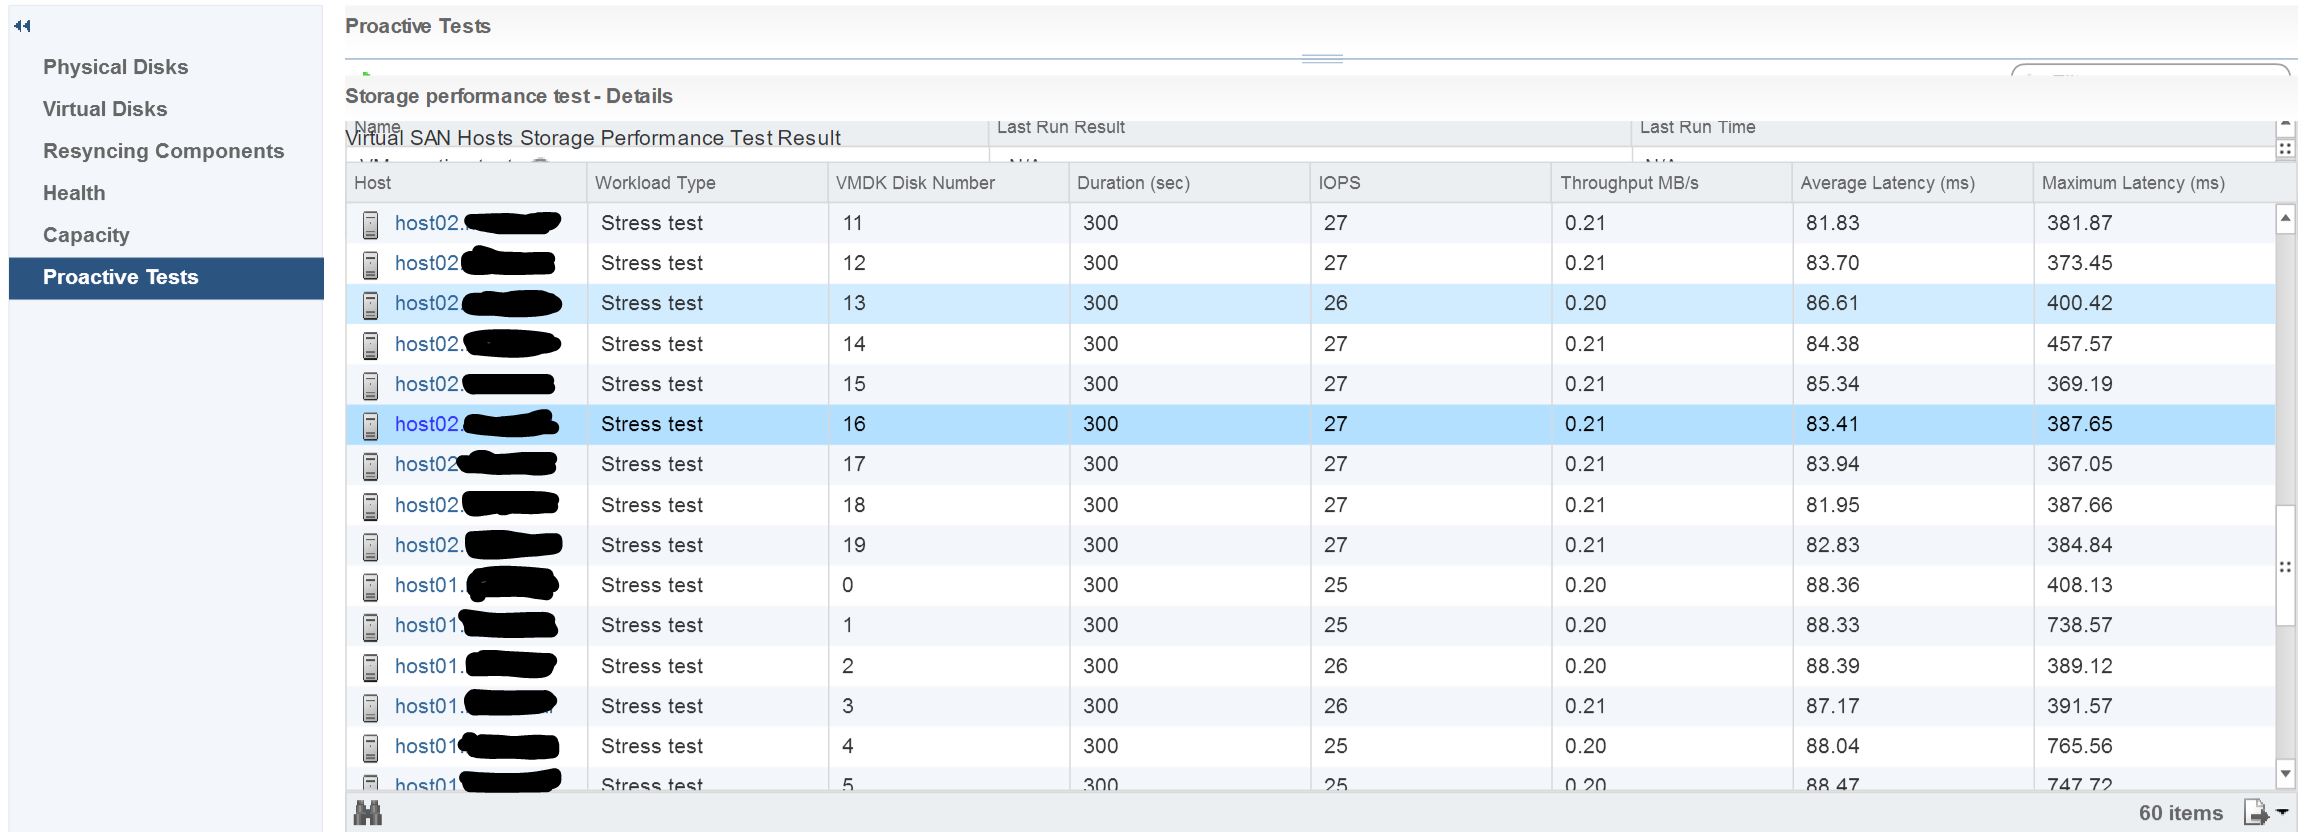
VSAN Storage Performance Test (Stress Test – 5 Min Duration – Default VM Storage Policy):
VSAN Storage Performance Test (Low Stress Test – 5 Min Duration – Default VM Storage Policy):
Summary:
VSAN 6.2 is a great product. It’s getting better and more feature rich by the release. This release alone added so much more health/performance/diagnostic information than ever before. Also, Deduplication and Compression, which were disabled in my tests, shipped as well. I’m looking forward to the progression of this software and have no doubt VMware will continue improving it. As for my opinion on using VSAN as my preferred HomeLab storage solution? I think I’ll wait a bit longer, but something I’ll keep my eye on.
Source:
